 |  fig2_egfr fig2_egfr |
|
Enter a Search String | | Special character and space not allowed in the query term.
Search string should be at least 2 characters long. |
Accession information for fig2_egfr (Accession Number 1)
Reaction Scheme

Accession Basic Parameters
| Name | fig2_egfr |
| Accession Type | Network |
| Transcriber | Upinder S. Bhalla, NCBS |
| Developer | Upinder S. Bhalla, NCBS |
| Entry Date (YYYY-MM-DD) | 2001-11-07 00:00:00 |
| Species | Generic mammalian |
| Tissue | Brain |
| Cell Compartment | Surface - Nucleus |
| Source | Bhalla US and Iyengar R. Science (1999) 283(5400):381-7. ( peer-reviewed publication ) |
| Methodology | Quantitative match to experiments, Hypothetical |
| Model Implementation | Exact GENESIS implementation |
| Model Validation | Approximates orginal data, Quantitatively predicts new data |
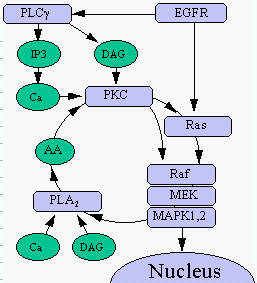
| Notes | This network was used to generate figure 2 in Bhalla US and Iyengar R. Science (1999) 283(5400):381-7. It consists of the MAPK cascade in a feedback loop with PKC, and receives input from the EGFR in the synapse.
Demonstration script files for generating the figures in the paper, including figure 2, are available here. |
Conversion formats| Format | File | | Native Format (GENESIS format) | acc1.g | | GENESIS Format (Annotated version) | Anno_acc1.g |
| Database compilation and code copyright (C) 2022, Upinder S. Bhalla and NCBS/TIFR
This Copyright is applied to ensure that the contents of this database remain freely available. Please see FAQ for details. |
|

