| Pathway Name | PLA2 |
| Pathway Entry Number | 183 |
| Accession Number | 35 |
| Accession Name | MAPK-bistability-fig1c |
| Species | Generic mammalian |
| Tissue | NIH 3T3 Expression |
| CellCompartment | Surface - Nucleus |
| Related Pathways | 3,
21,
36,
57,
62,
72,
208,
314,
331,
349,
365,
920,
922,
933,
939,
945,
951,
957,
964,
970,
976,
982,
988,
994,
1000,
1005,
1011,
1017,
1023,
1029,
1035,
1041,
1047,
1053,
1059,
1065
|
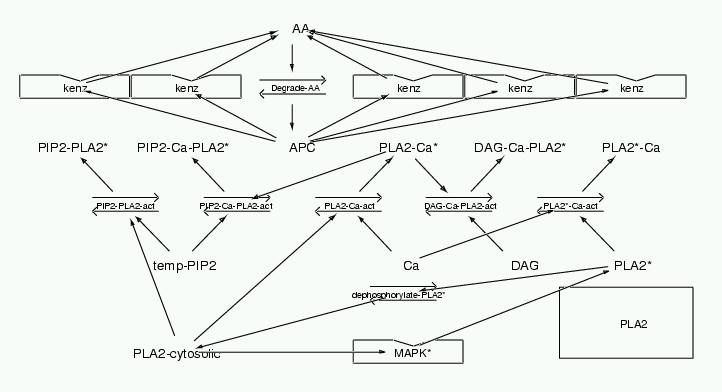
| Notes | Main source of data: Leslie and Channon BBA 1045 (1990) pp 261-270. Fig 6 is Ca curve. Fig 4a is PIP2 curve. Fig 4b is DAG curve. Also see Wijkander and Sundler JBC 202 (1991) pp873-880; Diez and Mong JBC 265(24) p14654; Leslie JBC 266(17) (1991) pp11366-11371 Many inputs activate PLA2. In this model I simply take each combination of stimuli as binding to PLA2 to give a unique enzymatic activity. The Km and Vmax of these active complexes is scaled according to the relative activation reported in the papers above.
|